TL;DR Monitor borgmatic with Prometheus textfiles
Setup and History
If you run infrastructure, you should have backups.
Backups are only useful if they are tested and monitored.
Part of my strategy to prevent “Schrödinger’s Backup” is tight monitoring and alarming.
In the early days, I had borgbackup running with Icinga. Later, I switched to Prometheus, with a textfile created by a custom bash script.
Right now, I’m cleaning things up in my infrastructure, and switching to borgmatic.
Borgmatic has no Prometheus support (yet), which brought me to the question: How to cleanly integrate borgmatic with Prometheus?
As borgmatic is running as a job from time to time, and not a service, the standard way (a /metrics-endpoint with a web server, borgmatic running as an exporter) is no option.
With a Prometheus node exporter already available on all machines, why not use it for monitoring borgmatic backups?
Prometheus textfiles
But first, how do we get the data into the Prometheus node exporter running locally?
node-exporter configuration
Similar to the pkg-exporter, we need to define a textfile directory in the flags during Prometheus node exporter start up:
--collector.textfile.directory=/var/prometheus/
All files inside /var/prometheus ending in “.prom” will be parsed by the node exporter, and appended to the output. For details, take a look at the official documentation.
Scripts can just place their output in this directory, and the metric will be available after the next scrape.
Note:
Another directory, e.g. /var/lib/node_exporter/textfile_collector, might be already configured especially if you use a packaged version of the node exporter. Make sure to adjust the configuration and directories accordingly.
Generating textfiles: The classic way
In my old scripts, I used some bash to generate the proper output:
PROM_FILE=$TEXTFILE_COLLECTOR_DIR/borgbackup_{{name}}.prom
TMP_FILE=$PROM_FILE.$$

echo "# TYPE backup_last_start gauge" >> $TMP_FILE
echo "backup_last_start{backup=\"{{name}}\"} $START" >> $TMP_FILE
echo "# TYPE backup_last_end gauge" >> $TMP_FILE
echo "backup_last_end{backup=\"{{name}}\"} $(date +%s)" >> $TMP_FILE
echo "# TYPE backup_last_exit gauge" >> $TMP_FILE
echo "backup_last_exit{backup=\"{{name}}\"} $RET" >> $TMP_FILE

mv $TMP_FILE $PROM_FILE
This solution has a major drawback: You cannot update metrics one by one, but have to write the whole file every time. Alternatively, you can have lots of files, which is not very clean either.
Generating textfiles: promtext-cli
Given the mentioned limitation, I’ve built promtext-cli.
This is a simple tool to do the job via a Command Line Interface: Specify the file, metric, label and value, and promtext-cli will merge it with the existing metrics (some limitations apply). It uses the official Prometheus client library for python, so the data types should be correct.
For example, the command
promtext tmp/backup.prom backup_last_start 0 --label backup=example_1 creates or updates the following metric:
# HELP backup_last_start
# TYPE backup_last_start gauge
backup_last_start{backup="example_1"} 0.0
Borgmatic Hooks and promtext-cli
With this tool, it is easy to create a borgmatic hook to generate the metrics.
The basic idea is still the same: Storing the Unix-timestamp something succeeded (or failed) the last time.
promtext-cli, as well as borgmatic is installed using pipx for me: pipx install promtext-cli; pipx install borgmatic.
You have to make sure that promtext is available in the PATH-Variable used, e.g. adding this to your systemd file.
I’m using this to start borgmatic with systemd:
ExecStart=bash -c "PATH=$PATH:/root/.local/bin/ borgmatic --verbosity -2 --syslog-verbosity 1 --list --stats"
In my borgmatic configuration, I have the following hooks:
# Hooks
before_backup:
  - promtext /var/prometheus/borgmatic_{backup_name}.prom borgmatic_start_time $(date +"%s") --label backup_name={backup_name} --label hostname={hostname} --label repository={repository} --label repository_label={repository_label}

after_backup:
  - promtext /var/prometheus/borgmatic_{backup_name}.prom borgmatic_success_time $(date +"%s") --label backup_name={backup_name} --label hostname={hostname} --label repository={repository} --label repository_label={repository_label}
  - promtext /var/prometheus/borgmatic_{backup_name}.prom borgmatic_error 0 --label backup_name={backup_name} --label repository={repository} --label hostname={hostname}

after_prune:
  - promtext /var/prometheus/borgmatic_{backup_name}.prom borgmatic_prune_time $(date +"%s") --label backup_name={backup_name} --label hostname={hostname} --label repository={repository} --label repository_label={repository_label}

after_compact:
  - promtext /var/prometheus/borgmatic_{backup_name}.prom borgmatic_compact_time $(date +"%s") --label backup_name={backup_name} --label hostname={hostname} --label repository={repository} --label repository_label={repository_label}

after_check:
  - promtext /var/prometheus/borgmatic_{backup_name}.prom borgmatic_check_time $(date +"%s") --label backup_name={backup_name} --label hostname={hostname} --label repository={repository} --label repository_label={repository_label}

on_error:
  - promtext /var/prometheus/borgmatic_{backup_name}.prom borgmatic_error_time $(date +"%s") --label backup_name={backup_name} --label hostname={hostname} --label repository={repository}
  - promtext /var/prometheus/borgmatic_{backup_name}.prom borgmatic_error 1 --label backup_name={backup_name} --label hostname={hostname} --label repository={repository}
As you can see, I use the hooks to generate a timestamp for nearly every step of the backup process, and a flag for errors. I also use labels for indicating my backup name, my hostname and the repository.
The output looks like this:
~# cat /var/prometheus/borgmatic_default.prom
# HELP borgmatic_start_time metric appended by promtext-cli
# TYPE borgmatic_start_time gauge
borgmatic_start_time{backup_name="default",hostname="fqdn.example.com",repository="ssh://examplerepo-1",repository_label="repolabel-1"} 1.722441931e+09
borgmatic_start_time{backup_name="default",hostname="fqdn.example.com",repository="ssh://examplerepo-2",repository_label="repolabel-2"} 1.722442171e+09
# HELP borgmatic_success_time metric appended by promtext-cli
# TYPE borgmatic_success_time gauge
borgmatic_success_time{backup_name="default",hostname="fqdn.example.com",repository="ssh://examplerepo-1",repository_label="repolabel-1"} 1.722442099e+09
borgmatic_success_time{backup_name="default",hostname="fqdn.example.com",repository="ssh://examplerepo-2",repository_label="repolabel-2"} 1.722442225e+09
# HELP borgmatic_error metric appended by promtext-cli
# TYPE borgmatic_error gauge
borgmatic_error{backup_name="default",hostname="fqdn.example.com",repository="ssh://examplerepo-1"} 0.0
borgmatic_error{backup_name="default",hostname="fqdn.example.com",repository="ssh://examplerepo-2"} 0.0
# HELP borgmatic_prune_time metric appended by promtext-cli
# TYPE borgmatic_prune_time gauge
borgmatic_prune_time{backup_name="default",hostname="fqdn.example.com",repository="ssh://examplerepo-1",repository_label="repolabel-1"} 1.722442162e+09
borgmatic_prune_time{backup_name="default",hostname="fqdn.example.com",repository="ssh://examplerepo-2",repository_label="repolabel-2"} 1.722442228e+09
# HELP borgmatic_compact_time metric appended by promtext-cli
# TYPE borgmatic_compact_time gauge
borgmatic_compact_time{backup_name="default",hostname="fqdn.example.com",repository="ssh://examplerepo-1",repository_label="repolabel-1"} 1.722442167e+09
borgmatic_compact_time{backup_name="default",hostname="fqdn.example.com",repository="ssh://examplerepo-2",repository_label="repolabel-2"} 1.722442231e+09
# HELP borgmatic_check_time metric appended by promtext-cli
# TYPE borgmatic_check_time gauge
borgmatic_check_time{backup_name="default",hostname="fqdn.example.com",repository="ssh://examplerepo-1",repository_label="repolabel-1"} 1.72244217e+09
borgmatic_check_time{backup_name="default",hostname="fqdn.example.com",repository="ssh://examplerepo-2",repository_label="repolabel-2"} 1.722442232e+09
If everything works, you should see graphs like this in your Prometheus: Query showing time since last successful backup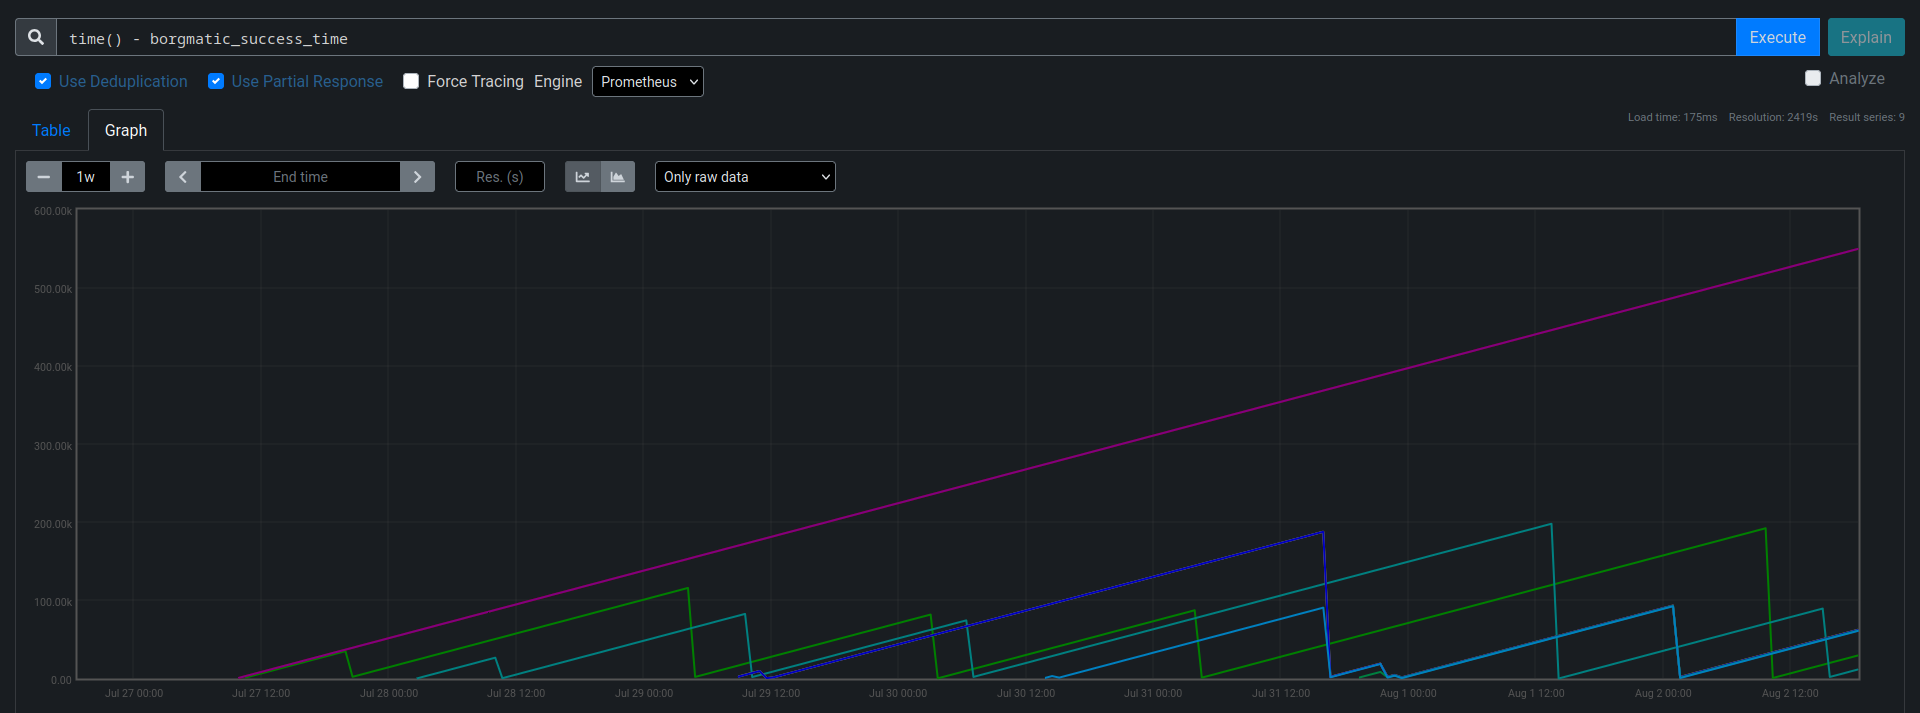
You can see that the “purple” backup did not succeed since a long time, while every “drop” back to zero indicates a successful backup.
Alerting
Based upon the now available metrics, you can create alerts in Prometheus.
My rules are attached below as an inspiration. You can adjust them to your needs, and should e.g. review labels and thresholds.
In general, I alert on the following conditions:
- error state active more than 3h
- last backup success more than 24h ago
- last backup start more than 24h ago
- last prune success more than 24h ago
- last check/check success more than 31 days ago
groups:
- name: borgmatic
  rules:
  - alert: BorgmaticError
    expr: min_over_time(borgmatic_error[3h]) > 0
    labels:
      severity: critical
      page: "true"
    annotations:
      description: 'The backup on {{ $labels.instance }} to {{ $labels.repository_label }} has an error active'
  - alert: BorgmaticLatestStart
    expr: time() - borgmatic_start_time > 3600 * 24
    labels:
      severity: warning
    annotations:
      description: 'The backup on {{ $labels.instance }} to {{ $labels.repository_label }} was started too long ago'
  - alert: BorgmaticLatestSuccess
    expr: time() - borgmatic_success_time > 3600 * 24
    labels:
      severity: critical
      page: "true"
    annotations:
      description: 'The backup on {{ $labels.instance }} to {{ $labels.repository_label }} succeeded too long ago'
  - alert: BorgmaticPrune
    expr: time() - borgmatic_prune_time > 3600 * 24
    labels:
      severity: info
    annotations:
      description: 'The prune on {{ $labels.instance }} to {{ $labels.repository_label }} was too long ago'
  - alert: BorgmaticCheck
    expr: time() - borgmatic_check_time > 3600 * 24 * 31
    labels:
      severity: info
    annotations:
      description: 'The check on {{ $labels.instance }} to {{ $labels.repository_label }} was too long ago'
  - alert: BorgmaticCompact
    expr: time() - borgmatic_compact_time > 3600 * 24 * 31
    labels:
      severity: info
    annotations:
      description: 'The compact on {{ $labels.instance }} to {{ $labels.repository_label }} was too long ago'
Conclusion
In general, this works great for me. Borgmatic is a much more clean way of triggering my backups than the “old, custom” scripts I used before. With Prometheus, I can sleep a little bit better, because I’ll know if something goes wrong.
This is of course no replacement for regularly testing e.g. the restore process, but it is a good start.
Also, for the future it might be interesting to integrate this functionality into borgmatic itself.